Loss happens often
Micro-stops, waiting, handling or inactivity appear every day.
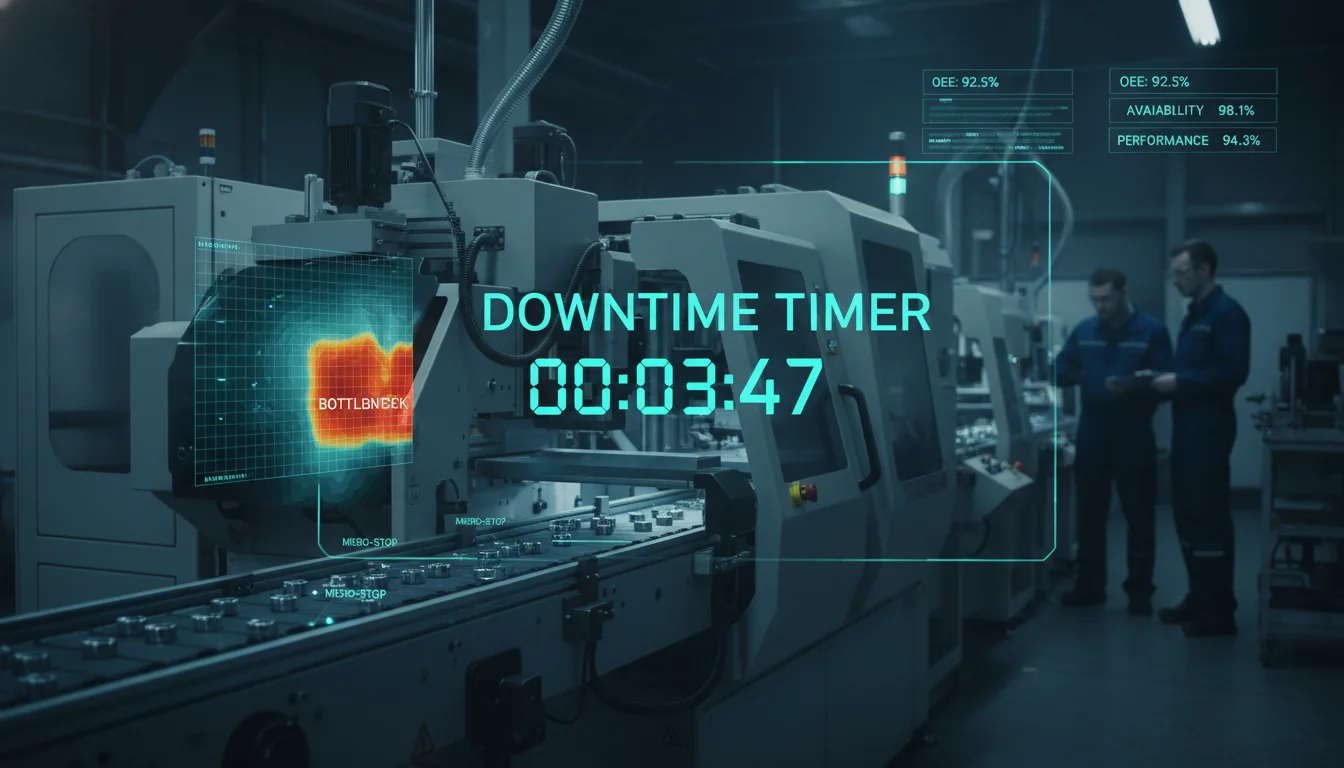
Peak connects AI to existing cameras without PLC or MES intervention. It tracks downtime, micro-stops, cycle times, operator utilisation and bottlenecks from the real production image.
Micro-stops, waiting, handling or inactivity appear every day.
The state of a machine, operator or material has a visual signal.
You need reason, duration and time context, not only a summary.
Short stops accumulate into major capacity loss.
The image separates work, waiting, material search and changeover.
A timeline shows where production flow regularly breaks.
Live events, filters, status and trend overview.
Image, timestamp, class and location for follow-up.
Export or alert for the responsible team.
Sees where the team loses time during a shift.
Gets causes for Kaizen, layout and work standard changes.
Tracks capacity impact without extra administration.
Peak turns line footage into an event timeline: running, stopped, waiting, operator intervention or blocked flow. Production managers see not only the OEE number, but the reasons behind lost performance.
Assumes 250 production days per year and linear OEE impact. This is not a guaranteed result; accuracy is validated in a pilot.
Choose the next problem you want to solve on the same camera layer.
Send us the line type, camera setup and key losses. We will propose a pilot that shows downtime and causes without PLC intervention.